


")

Tops can not…
Now the third condition of measurement which, alas, for too many quite expensive. This applies RF emitters. Stuff, in short. On page three (out of seven) of the official text of IEC contains the phrase: "for emitters designed to work within the audio range, the measurement of the power produced at the input of the filter, allocating the required bandwidth". Tedious says, no doubt. But the point is what it is. Suppose that you have a Squeaker, which States: the working frequency band of 2 to 20 kHz. Standard (standard - Holy, especially if as a result of its application the numbers get prettier) need to activate the Squeaker through a filter that passes frequencies above 2 kHz, and the amplitude (or power, therefore) measured AT the input of the filter. Then get: - all power corresponding to a standard distribution curve by the spectrum, as on the chart. That is, on average is much lower, and upper frequencies of the spectrum have less than nothing. The nose and into the Squeaker, and it feels good.
The most competent (and, as a consequence, the most conscientious) manufacturers of lead indicators of output and input, and standard output of the filter. And point (further - a quote from a professional technical documentation Philips): "the Maximum permissible power (inlet/outlet) - 20/4 W (filter 2000 Hz, 12 dB/Oct.) or 50/6 W (filter 4000 Hz, 12 dB/Oct.)". For experts, it is clear: in the numerator input of the filter, the denominator of the output. The difference felt, or what? In the paper, applied to the speaker, so please, you write only the numerator. In the numerator - the fierce power of the wideband signal coming to the crossover filter that selects the signal to the tweeters. The filter from the inlet cuts (in accordance with their characteristics) a small fraction verniciatura components intended for playback RF head.
Thanks standardized spectrum there is not God knows how much remains of the total capacity. And after the filter - well, you attach a line to a chart and see how much. The dynamics have to digest and make the denominator of a fraction given an honest manufacturer. But how much was burned stuff in the eternal war of the numerator with the denominator is impossible to say, and to pay damages - even more difficult. Practical conclusion: other things being equal resilience tweeters directly related to the characteristics of the filter through which it is connected. To a greater extent than with the characteristics of the tweeters as the sample of engineering.
How many have been burned stuff in the eternal war of the numerator with the denominator…
Well, this is the standard, the standard, the principle and the average benchmark. And as for life, in the sense of "pure-specifically, on the basis of a live musical material. Let's see: here's the curve of spectral distribution of the signal amplitude, averaged over approximately 20 CDs with recordings of classical music genre: mostly performed by a full Symphony orchestra.
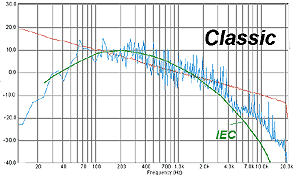
The averaged spectrum of classical music of all times and peoples" in comparison with its standardized performance.
On the chart - averaged spectrum of classical music (long saved and averaged) is the blue curve. Red - spectral response with pink noise. She will be present everywhere on future charts to serve as a guide. Because the spectrum of pink noise sample uniform energy distribution in octave bands. Spectrum pink noise in our experiments were taken from the same CD player as the rest of the soundtrack, so that there is confidence that the path passes all the investigated frequency range. (Recording of pink noise was used with disk IASCA Competition. The quality of the signal does not require comments - and so everything is visible. For information experimenters: we tried several records on test drives, labeled as pink noise, but truly uniform feature found only on IASCA, Competition or Setup&Test, no matter the recording of the same.)
Returning to the schedule. Look: indeed, the distribution of the power spectrum is very similar to what was offered (until 1969) the International Electrotechnical on the upper frequencies, but contemporary records give more amplitude than expected, but this factor we will evaluate later on a special material. Now over to the rock, under the pressure which in 1969 curve "music of all time" was updated.
"Races" performed by Yello - the standard uniform energy distribution.
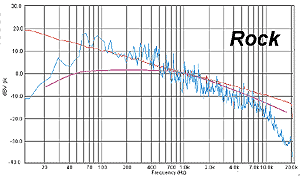
The average range of rock music and the standard spectral curve DIN.
Averaged through our efforts, the spectral response of the rock records (from Dire Straits to AC/DC) - on the chart. Here at higher frequencies, the music even correspond to "disciplining" of the standard curve range. But on the bottom shows the real power of the signal can be significantly higher than assumed in the standard.
Just, maybe, detracting from the overall plan of the narrative, we show another response, it is very typical it was. Not only what the presentation, show or other performance with the image and presentation of prizes passes now without execution of a work group Yello called "Races". Really - very emotional and exciting. When we test the auditions equipment always included the track in the repertoire, since it is much audible. However, only by removing the spectrogram, it became clear, at least in part, why such fullness. Look, a rare thing.
Literature
- The Magazine "Car Audio" No. 11 / 2000
Author: Andrew Elyutin; Publication: www.avtozvuk.com, www.cxem.net